Description
Create and display a Data Chart on your site within a few click. Easily visualize your data!
This plugin supports 8 chart types: bar, line, area, pie, bubble, radar, polar, and scatter.
How To Use?
- Go to -> B-Chart from Dashboard menu -> Add New.
- Configure the Chart according to your preference
- Copy the Generated shortcode from the chart edit screen and paste in shortcode block in the edit screen of a post or page.
- Enjoy !!!
⭐ Checkout our other WordPress Plugins
🔥 Html5 Audio Player – Best audio player plugin for WordPress.
🔥 Html5 Video Player – Best video player plugin for WordPress.
🔥 PDF Poster – A fully-featured PDF Viewer Plugin for WordPress.
🔥 StreamCast – A fully-featured Radio Player Plugin for WordPress.
🔥 3D Viewer – Display interactive 3D models on the webs.
Captures d’écrans
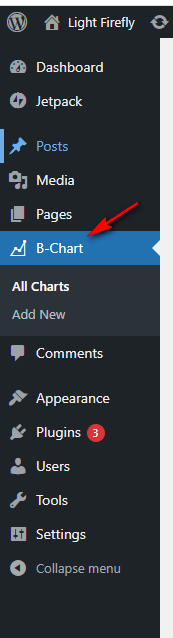
Sidebar menu 
Chart List 
Create Chart 
Pie Chart 
Line Chart 
Bar Chart 
PolarArea Chart 
Radar Chart 
Doughnut Chart
Installation
This section describes how to install the plugin and get it working.
e.g.
- Upload
plugin-directoryto the/wp-content/plugins/directory - Activate the plugin through the ‘Plugins’ menu in WordPress
- Use shortcode in page, post or in widgets.
- If you want player in your theme php, Place
<?php echo do_shortcode('YOUR_SHORTCODE'); ?>in your templates
Avis
Contributeurs/contributrices & développeurs/développeuses
« B Chart – Line, Bar, Pie, and Other Charts » est un logiciel libre. Les personnes suivantes ont contribué à cette extension.
Contributeurs“B Chart – Line, Bar, Pie, and Other Charts” a été traduit dans 2 locales. Remerciez l’équipe de traduction pour ses contributions.
Traduisez « B Chart – Line, Bar, Pie, and Other Charts » dans votre langue.
Le développement vous intéresse ?
Parcourir le code, consulter le SVN dépôt, ou s’inscrire au journal de développement par RSS.
Journal des modifications
1.0.1
- Added Pie Chart Option
- Improved Settings Panel
- More organized Options
- Added new Screenshots
- Fix mirror issues
1.0.0
- Initial Release